‘Lifetime Heat Maps’ for Analyzing Employee Performance
Analyze and improve employee performance with 'Lifetime Heat Maps' for detailed insights and data-driven results.

In today’s highly competitive business world employee performance analysis is critical
to the success of any business. With the right tools and insights, you can identify areas where your workforce is
excelling and areas where there might be room for improvement.
That’s why we’re excited to introduce Time Champ new ‘Employee Lifetime Heatmaps’ feature – a revolutionary way
to analyze employee
performance. With the introduction of Time Champ’s new ‘Lifetime’ feature, managers can now gain valuable
insights into their workforce like never before.
What is Heat Map?
A heatmap is a graphical representation of data that uses a color-coding system to visualize the relative magnitude of values in a matrix. Heatmaps are commonly used in various fields such as business, finance, sports, and science to visualize data in a meaningful and easily understandable way.
Boost efficiency with data-driven insights!
Track work patterns with Lifetime Heat Maps in Time Champ. Start today!
What is “Lifetime Heat Maps” Feature?
The ‘Lifetime’ is the new feature of Time Champ the productivity management software. It is an innovative tool that leverages data from Time Champ’s and productivity management and Employee monitoring tools to provide a detailed view of your workforce’s performance. By creating heatmaps for Working time, Productive time, Away time, and Leaves, ‘Life Time’ makes it easy to identify patterns and trends that might be difficult to spot otherwise. With each cell representing a day and the intensity of the color indicating the number of worked hours, productive hours, away hours, and leaves, you get a comprehensive view of your workforce’s activity. When clicked on the specific cell, you will get the detailed view of the employee activity on that day like attendance report including total time spent, number worked hours, productive hours and employee productivity reports including number of productive hours, list of productive and unproductive applications used.
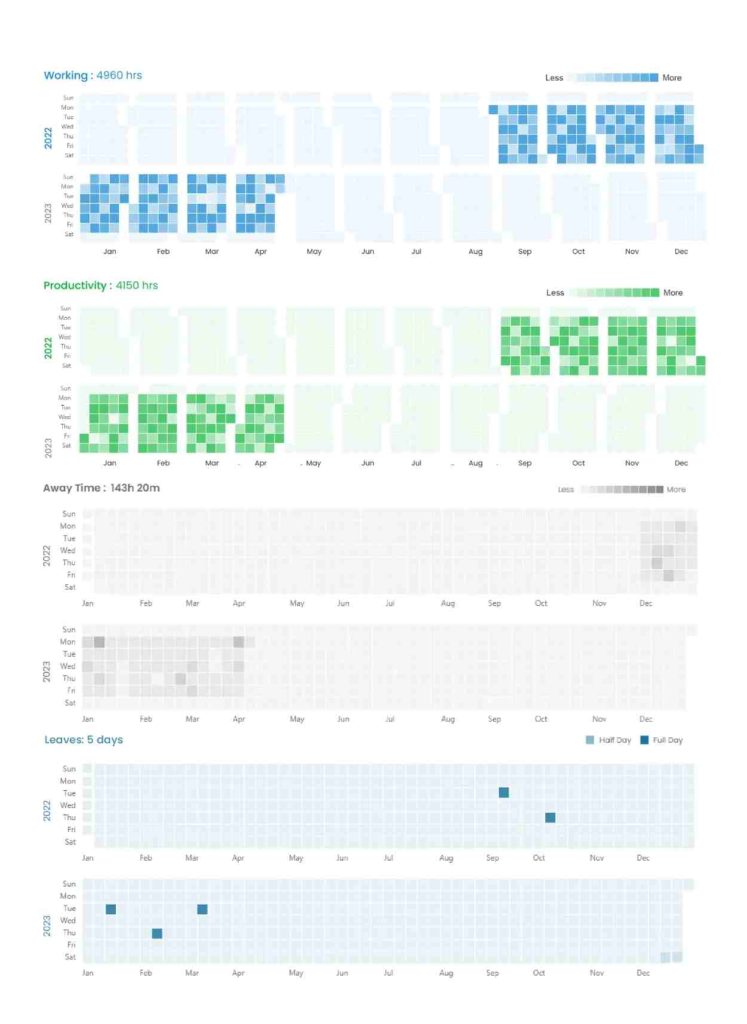
Working Time Heatmap:
The work time heatmap shows the number of hours worked by each employee, with the
intensity of the color indicating the number of hours worked lower intensity indicating a smaller number of worked
hours and higher intensity for higher number of worked hours.
The Working time heatmap provides a comprehensive
view of your employees’ work habits. You can quickly identify which days of the week employees are most productive
and how their work hours change over time. This feature is particularly useful for identifying patterns in work
habits that might be affecting overall productivity.
Productive Time Heatmap:
The productive time heatmap is an excellent tool to analyze employee productivity and to know how employees are spending their work time. The productive time heatmap shows the number of hours that each employee was productive, with the intensity of the color indicating the number of productive hours. With this heatmap, you can easily see which employees the most productive and which tasks are take up the most time. By clicking on the specific cell managers can view the entire productivity breakdown of the employee on that day. This information can be used to identify areas where training or process improvements might be needed.
Away Time Heatmap:
The away time heatmap leverages data from Time Champ’s employee time tracking feature to show the number of hours that each employee was away from work, with the intensity of the color indicating the number of away hours. The away time heatmap provides insight into how often employees are taking breaks, leaving early, or arriving late. This feature is particularly useful for identifying trends in absenteeism and can help you develop strategies to improve attendance.
Leaves Heatmap:
The leaves heatmap is an invaluable tool for managing employee leave requests. The leaves heatmap shows the number of leaves taken by each employee, with the two intensities of color lower intensity indicating the half day and higher intensity for full day leave taken. With this heatmap, you can quickly see which days are the most popular for taking leave and which employees are taking the most time off. This information can be used to manage staffing levels and ensure that all departments are adequately staffed.
What are the Benefits of Using ‘Lifetime’?
-
One of the key benefits of using ‘Lifetime’ is that it provides a comprehensive view of your workforce’s activity. With its powerful heatmaps, you can quickly identify areas where your team is performing well, as well as areas where there might be room for improvement. For example, if you notice that there’s a lot of away time on Wednesdays, you might decide to adjust your scheduling to ensure that everyone is available when you need them.
-
‘Lifetime’ helps you to track the workforce’s productivity. By seeing the number of productive hours worked by each employee, you can identify your top performers and ensure that they’re being appropriately rewarded.
-
Another benefit is that ‘Lifetime’ helps you to stay on top of your leave management. With a clear view of who is taking leave and when, you can plan your staffing requirements more effectively and ensure that there are no gaps in coverage.
Uncover hidden productivity trends!
Use Time Champ’s Lifetime Heat Maps to analyze and optimize employee performance. Try it now!
Conclusion
In conclusion, the Time Champ’s ‘Lifetime heat
maps’ feature offers businesses a revolutionary new way to analyze employee performance. With the ability to quickly
and easily view work time, productive time, away time, and leaves in a heatmap format, businesses can make better
decisions, optimize their workforce, improve employee productivity, and achieve better results.
With Time
Champ, you can ensure that your team stays on task and productive throughout the workday.

Thasleem Shaik

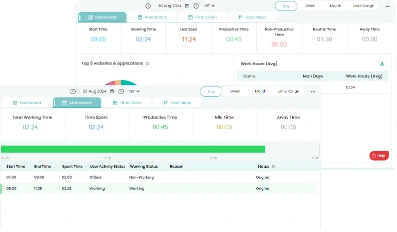
Table of Content
-
 What is Heat Map?
-
What is “Lifetime Heat Maps” Feature?
-
What are the Benefits of Using ‘Lifetime’?
-
Conclusion
Related Blogs
Explore Time Champ’s new Audio Tracking feature. Monitor employee activity with audio and screen recording for detailed insights.
Shabana Shaik | 18 March 2025
Discover the best ways to introduce productivity monitoring in your organization smoothly and effectively.
Thasleem Shaik | 18 March 2025
Boost team productivity and performance with effective tracking methods. Enhance productivity through data-driven insights and actionable strategies.
Shabana Shaik | 17 March 2025Productivity Tracking Software helps remote teams stay on top, track progress, streamline workflows & boost efficiency effortlessly. Learn more!
Shabana Shaik | 15 March 2025
Learn how to boost productivity by finding the right balance in employee monitoring, focusing on key indicators, and maintaining transparency
Tarun Kumar | 14 March 2025
Boost employee productivity with workday insights that improve efficiency, streamline workflows, and drive better performance.
Thasleem Shaik | 13 March 2025Ready to Manage Your Workforce Smarter?
Join our family of 1100+ companies using smart insights to redefine workforces!
Free Trial
No Credit Card Required