What is a Timeline? and its Popular Techniques
Learn how timelines work, and their importance in project management, and explore popular techniques like Gantt charts, PERT, and historical timelines.
What is a Timeline?
A timeline is a graphic display of events or activities that are arranged in a chronological manner. It is useful in showing how events unfold in a given time frame and can help to identify key events, dates or events in history. Timelines can be linear, vertical, or graphical, and they are commonly used in project management, history, and education to provide a clear and organized overview of time-related information.
Why are Timelines Important?
Timelines are useful for documenting any type of development, providing a clear history, and assisting viewers in understanding past and current trends. It can also help with managing tasks.
- Organizes Information: They organize events or tasks in order so that you can easily tell what happened when and how things relate to each other.
- Tracks Progress: They help monitor progress over time, showing whether goals and deadlines are being met.
- Improves Planning: They help in better planning by showing the deadlines and the milestones and helping with time management and scheduling.
- Enhances Communication: They provide a clear, visual way to share information and updates with others, making complex data easier to understand.
How Do Timelines Work?
Timelines help in organizing every project, task, or milestone in sequential order along a line, showing their progression over time. Using timelines, you can define the time frame and scale, and then plot events chronologically. To simplify this process, many users rely on a free timeline maker that streamlines event plotting and enhances visual clarity. Then the key details and notes are added to provide more information. Timelines show how things progress and make it easy to understand and share information.
Popular Timeline Techniques
There are many types of timeline techniques, here are a few popular ones.
Gantt Chart
The Gantt Chart is one of the most popular timeline techniques, especially in project management. It is a graphical representation of tasks in a horizontal manner with the start and end dates of the tasks and their relation with each other. Each task is represented by a horizontal bar, and its length represents the duration of the task.
PERT Technique
The Program Evaluation and Review Technique (PERT) is a statistical tool that is used to analyze and estimate the time that is needed to accomplish a project. It aims at determining the shortest time required by finding the critical path, which is the longest chain of dependent activities. PERT offers an optimistic, pessimistic and most probable time for the completion of each task.
Historical Timeline
A Historical Timeline is often used to depict the major events in history or the major events in a person’s life or an organization’s development. Historical timelines are usually drawn in a linear manner either in the horizontal or vertical form and are useful in the simplification of complex historical data.
Project Timeline
A Project Timeline is a document that shows the activities, events, and time frame of a specific project. It offers an overall picture of the project and makes it possible to complete the tasks within the required time. While a Gantt chart deals with certain durations, a project timeline is more likely to concentrate on major milestones.
Roadmap Timeline
A Roadmap Timeline is a tool that focuses on significant objectives, milestones, or products in a broader timeframe. Business strategies or product development plans often include roadmaps that show the goals for the future and how they will be attained.

Shabana Shaik

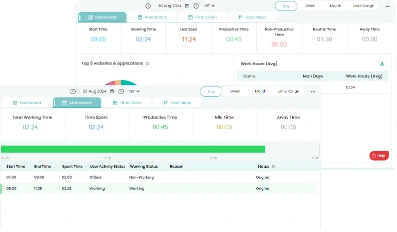
Table of Content
-
 What is a Timeline?
-
Why are Timelines Important?
-
How Do Timelines Work?
-
Popular Timeline Techniques
Related Blogs
Learn the benefits of a work time tracker, from boosting productivity to improving accuracy and streamlining workflow for better efficiency.
Thasleem Shaik | 13 March 2025Get free attorney time tracking templates in Excel, PDF, and Word to streamline billing, improve accuracy, and manage billable hours
Thasleem Shaik | 12 March 2025
Learn how to track time for remote workers with the best tools, methods, and practices to boost productivity and accountability.
Thasleem Shaik | 8 November 2024
Explore how Time Sheet Automation Professional Services can transform your operations with seamless time tracking and customized reporting solutions.
Jahnavi Pulluri | 8 November 2024
Learn what a timesheet is, its uses, and how it improves work hour tracking, project management, and business efficiency.
Jahnavi Pulluri | 26 October 2024Uncover the chaos of a day without time tracking. Explore how managers struggle with productivity, accountability, and team coordination in
Jahnavi Pulluri | 25 October 2024Ready to Manage Your Workforce Smarter?
Join our family of 1100+ companies using smart insights to redefine workforces!
Free Trial
No Credit Card Required