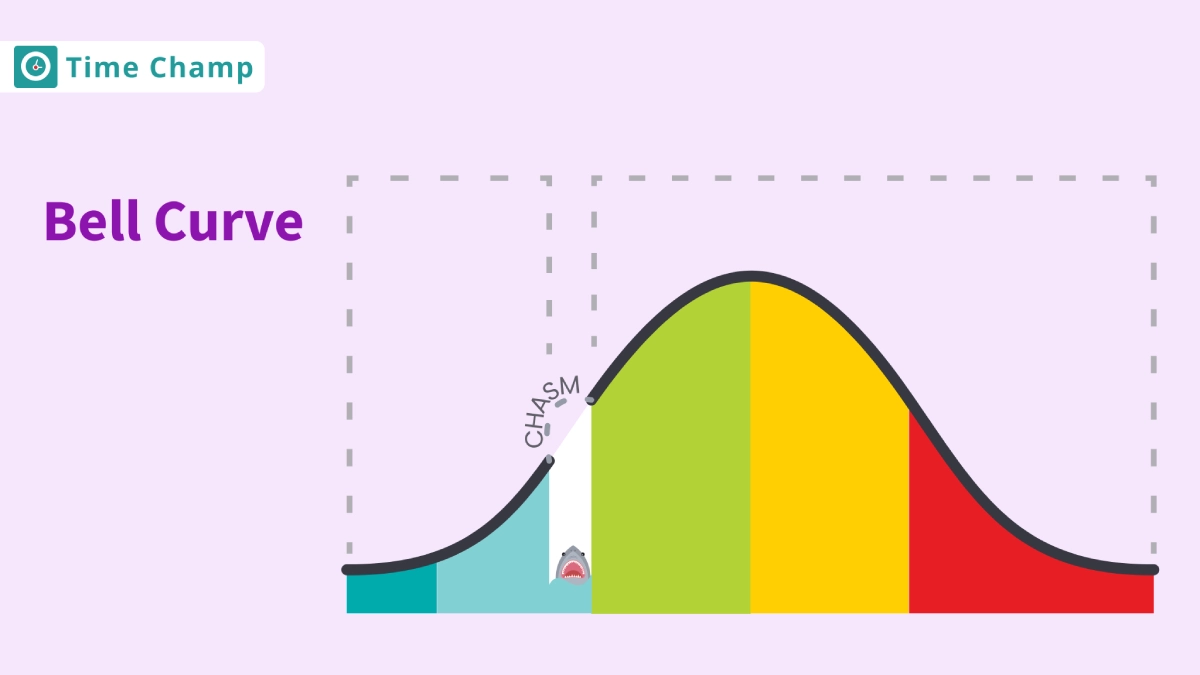
What is the Bell Curve?
A Bell Curve is a graphical
representation of normal
distribution and is in the shape of
a bell. This statistical instrument
is used to demonstrate the spread of
a dataset in which most values are
concentrated near the mean and form
a symmetrical bell-shaped curve. The
top of the curve represents the
mean, mode, and median of the
collected data, indicating the
central tendency.
The Bell
curve, also referred to as forced
ranking or stack ranking, is a performance
appraisal method used to
evaluate and classify
employees’ performance levels.
In this approach, employees are
categorized into various performance
groups based on their achievements,
skills, and other performance
indicators, with the majority
falling in the middle, while fewer
employees are rated at the extremes
of high
or low performance.
The Role of Bell Curve in Performance Appraisal
1. Performance Distribution
Employers are required to put employees into predetermined performance categories, which are usually based on a bell curve distribution. These categories include “top performers,” “average performers,” and “below-average performers.”
2. Percentage Allocation
The bell curve method divides employees into groups based on performance: 10% high performers, 70% average performers, and 20% low performers. Most fall in the middle, reflecting a balanced performance range.
3. Consequences and Rewards
Based on this distribution, the performance ratings that are allocated may have an impact on compensation, promotions, and other rewards or consequences. Good-performing employees may receive bonuses or get promotions, while poor performers may need performance improvement plans or other corrective actions.
Impacts of Bell Curve in Performance Appraisal
1. Unhealthy Competition
The bell curve system often encourages employees to compete against each other, prioritizing personal success over teamwork. This can create an unhealthy atmosphere, negatively impacting collaboration and shared goals.
2. Unfairness and Bias
The forced ranking system may lead to unfair judgments and bias. Categorizing employees into fixed percentages can overlook individual contributions and skills. Employers might feel pressured to manipulate ratings, compromising the fairness and accuracy of evaluations.
3. Stifles Creativity
The rigid structure of the bell curve discourages risk-taking and innovation. Employees may fear trying new ideas or taking on challenging projects, worrying about the impact on their rankings. This can hinder creativity and slow down overall progress.
4. Ignores External Factors
The bell curve doesn’t consider external factors affecting performance, such as market changes or industry trends. Employees may be unfairly judged for things beyond their control, leading to inaccurate assessments.
5. Lack of Personal Feedback
The forced ranking system often results in a lack of individualized feedback. As employees are grouped into fixed percentiles, managers may overlook providing specific insights into strengths, weaknesses, or areas for improvement. This hampers personal development.
What is the Bell Curve Principle?
The Bell Curve Principle, also known as the Normal Distribution, is a statistical concept describing a pattern where most observations or values in a dataset are concentrated around the mean (average), with fewer occurrences as you move farther away in either direction. The graph of this distribution looks like a bell, with a balanced shape.
What is the Bell Curve Performance Management?
In HR, the Bell Curve is used to rank employees. Most people get average scores, such as in the middle of a bell curve. Some get high scores, while a few get low scores. It helps companies see who’s doing well and who might need more support.
With this method, organizations can easily spot top performers and those who might need extra help to understand the skills of their team better. The problem is that systems such as the Bell Curve can lead to unhealthy competition and make team morale worse.
Also Read:
Ways to use productivity intelligence to improve team performance
Importance of Goal Setting to Increase Employee Productivity
Frequently Asked Questions
It’s called the Bell Curve because when the data is plotted on a graph, it forms a shape that looks like a bell, symmetrical with a peak in the middle.
This rule explains
that:
About 68% of
the data falls within
one standard deviation
of the mean.
About
95% falls within two
standard
deviations.
About
99.7% falls within three
standard deviations.
A perfect bell curve is symmetrical, with data points evenly distributed around the mean. It has a single peak at the center and tails that extend infinitely in both directions, although practically, the tails are limited by the range of data.
No, not all data follows a Bell Curve. Some data may be skewed or have a different distribution, such as a bimodal distribution (two peaks) or uniform distribution (evenly spread out).


